Your Farm Records, Weather and Satellite Data, Working Together
See Your Own Fields from Space at Stand 4.954
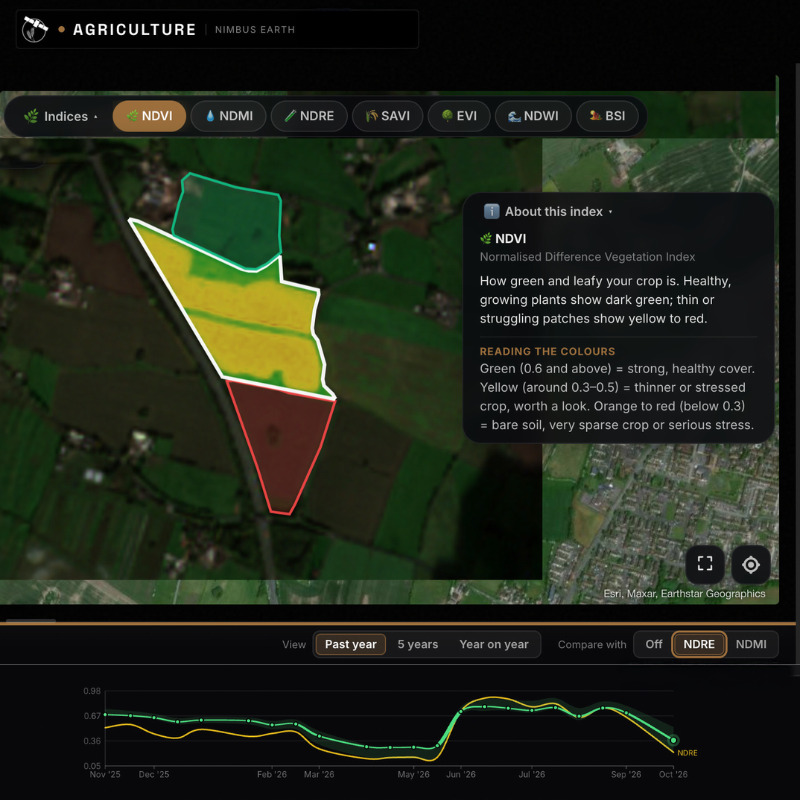
Bring a postcode to LAMMA 2027. At Stand 4.954 in Hall 4, we'll find your field on the map, draw its boundary and show you what satellites have recorded there: how the crop has grown, where it is stronger or weaker, and estimated soil moisture.
That is Nimbus Earth Agriculture, a farm management application from British software company Blackscape Ltd. It brings your farm records, local weather and regular satellite observations together in one place and explains them in plain terms. It runs in a web browser on a computer, tablet or phone, with nothing to install.
Why we built it
"Farmers already have plenty of information: spray records, weather apps, satellite images, scheme guidance. The trouble is that it lives in different places and rarely talks to itself. Much similar software requires expensive equipment or high ongoing fees. We built Nimbus Earth Agriculture so that the records you already keep work together with the weather and the satellite readings, giving you a clearer view of each field at a fair, affordable price."
— Simon Williams, founder, Nimbus Earth
Your records do more than keep a history
The Management Hub is where you log the season: sowing, fertiliser and spray applications, irrigation, mowing and baling, stock moves, scouting, soil tests and harvest, along with your own notes. Spray entries build into a spray register for each field. These entries also feed the application's calculations:
· Sowing dates set the starting point for crop growth stages and growing degree days.
· Irrigation is added to the field's water balance, so the estimate of when the crop next needs water accounts for what you have already applied.
· Harvest yields are compared with the model's estimate, and the comparison improves future estimates for that field.
· Stock moves keep the number of animals on each grazing field up to date for the forage budget.
The records you keep anyway end up doing useful work.
Satellites as another pair of eyes
Regular satellite images show how each crop is developing. Field heatmaps show the variation within a field, and past readings put this season in context. Clouds can hide the crop for a while, but radar satellites see through them, so you can still estimate soil moisture.
On Pro, management zones go a step further. They compare three years of clear images to find the parts of a field that are consistently stronger or weaker, not one-off patches, and add elevation and slope.
Satellite readings sit alongside your records and the weather; they don't replace them. Yield projections, soil moisture and other modelled figures are estimates. Walking the field and agronomic judgement remain essential before deciding what to do.
Official information, in context
For fields in England, the application lists Sustainable Farming Incentive (SFI) actions that may suit each field, with rates checked against GOV.UK every day. It also checks whether the field lies in a Nitrate Vulnerable Zone, a Site of Special Scientific Interest, or upland and moorland areas. This is guidance only, not an eligibility assessment: check the current scheme rules and whether applications are open on GOV.UK. The Rural Payments Agency makes the final decision.
Across Great Britain, official Defra and APHA updates on bird flu, bluetongue and foot-and-mouth disease appear word for word, with a link to the full notice on GOV.UK. These notices are free on every plan.
What to expect at Stand 4.954
· Your own field, live. Give us a postcode or find your farm on the map, and we'll show you the field's satellite history and estimated soil moisture.
· A walk through a season. We'll use demonstration fields to show how records, weather and satellite readings come together over a year.
· Set up before you leave. If you like what you see, save your fields on the stand and start a free 30-day Pro trial, so your fields are waiting when you get home.
· Straight answers. Ask us what the application does well, what it doesn't do yet and what is coming next.
Try it on your own fields now
Don't wait for January. Open nimbusearth.com/lamma to explore Nimbus Earth Agriculture with every feature switched on, with no sign-up needed. Draw your fields and see what the satellites have recorded. If you save your fields, you get 30 days of Pro free. Places are limited, and the offer closes on 28 February 2027.
Plans
Free: up to 3 fields and 30 hectares, with crop monitoring, estimated soil moisture, current weather and forecasts. Free for as long as you want it.
Pro: £20 a month or £200 a year, plus VAT, for up to 20 fields and 300 hectares. It adds every crop index, management zones, alerts, the full SFI list, data exports and calibration with your own field measurements.
Business: £75 a month or £750 a year, plus VAT, for up to 100 fields and 2,500 hectares, with three team seats. Suited to larger farms and contractors.
You can change plans or cancel at any time.
Visit us at LAMMA 2027
Stand 4.954, Hall 4, NEC Birmingham.
Wednesday 20 January 2027, 8 am–6 pm, and Thursday 21 January, 8 am–4.30 pm.
Visitor tickets are free if you register before 4 January 2027.